مقدمة
يمكن العثور على جميع الأمثلة التي سيتم تقديمها في المقالة هنا في هذا دفتر الملاحظات ، وسيتم إخفاء المادة الرئيسية تحت المفسدين نظرًا لوجود الكثير من الرموز والصور المتحركة. لإعادة إنتاج بعض الأمثلة التي سيتم تقديمها في أي حال ، ستحتاج إلى هذا المستودع نظرًا لاحتوائه على بعض الأدوات المساعدة الوسيطة.
كيفية تحريك
تحت Jupyter ، توجد مجموعة من عناصر واجهة المستخدم ( ipywidgets ) ، وهي أنواع مختلفة من أدوات الإدارة ، تتفاعل مع وحدة العرض IPython.display لتوفير تصور تفاعلي. يمثل الكود التالي كل تفاعلات عنصر واجهة المستخدم التي يمكن استخدامها للتحريك بشكل تفاعلي على محتويات القائمة:
from ipywidgets import interact, interactive, fixed, interact_manual
import ipywidgets as widgets
from IPython.display import display


def step_slice(lst, step):
    return lst[step]


def animate_list(lst, play=False, interval=200):
    slider = widgets.IntSlider(min=0, max=len(lst) - 1, step=1, value=0)
    if play:
        play_widjet = widgets.Play(interval=interval)
        widgets.jslink((play_widjet, 'value'), (slider, 'value'))
        display(play_widjet)
        # slider = widgets.Box([play_widject, slider])
    return interact(step_slice,
                    lst=fixed(lst),
                    step=slider)
إليك ما تحصل عليه إذا قمت بتغذية دالة animate_list بقائمة من الأعداد الصحيحة:
a = [10, 9, 8, 7, 6, 5, 4, 3, 2, 1]
animate_list(a, play=True, interval=200);
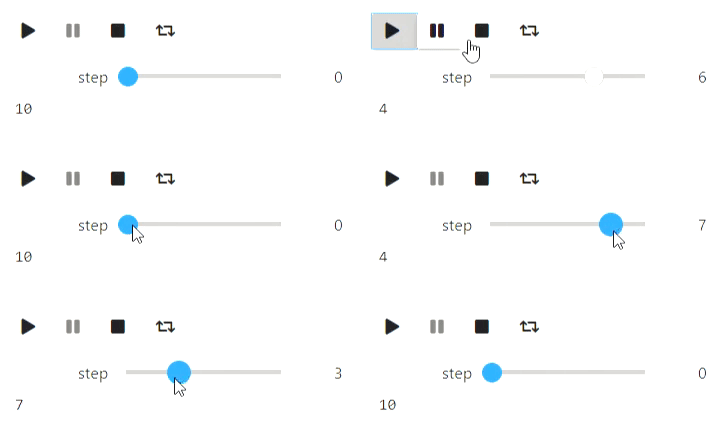
لتوضيح كيفية عمل الخوارزمية باستخدام animate_list ، تحتاج إلى إنشاء حالات وسيطة للخوارزمية وحفظ تمثيلها المرئي بالتنسيق المطلوب.
الرسوم المتحركة النصية
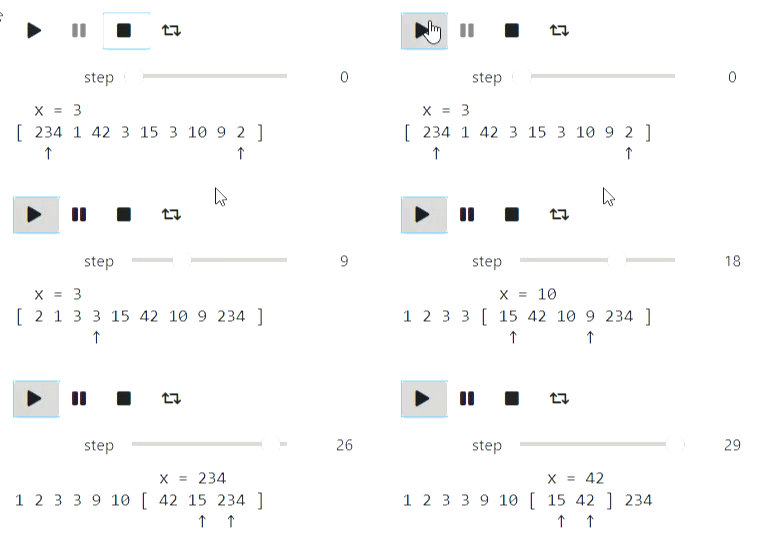
الخوارزميات الأساسية للعمل مع التسلسلات / المصفوفات هي تمثيل نصي كافٍ. لسوء الحظ ، واجهت مشكلات في السلاسل الأساسية التي رفضت التعامل مع موجزات السطر ، ونتيجة لذلك استخدمت IPython.display.Code. لنبدأ بالترتيب السريع الكلاسيكي.
الرمز
from IPython.display import Code
import random

def qsort_state(array, left, right, x, p, q):
    extended_array = list(map(str, array[:left])) + ['['] + list(map(str, array[left: right])) + [']'] + list(map(str, array[right:]))
    offset_x = sum(list(map(len, extended_array[:left]))) + left + 2
    zero_line = ''.join([' ' for i in range(offset_x)]) + f'x = {x}'
    first_line = ' '.join(extended_array)
    offset_p = sum(list(map(len, extended_array[:p + 1]))) + p + 1 + len(extended_array[p + 1]) // 2
    offset_q = sum(list(map(len, extended_array[:q + 1]))) + q + 1 + len(extended_array[q + 1]) // 2
    second_line = ''.join([' ' if i != offset_p and i != offset_q else '↑' for i in range(len(first_line))])

    return Code(zero_line + '\n' + first_line + '\n' + second_line)

def qsort(array, left, right, states):
    if right - left <= 1:
        return
    x = array[random.randint(left, right - 1)]
    p = left
    q = right - 1
    states.append(qsort_state(array, left, right, x, p, q))
    while p <= q:
        while array[p] < x:
            p += 1
            states.append(qsort_state(array, left, right, x, p, q))
        while array[q] > x:
            q -= 1
            states.append(qsort_state(array, left, right, x, p, q))
        if p <= q:
            array[p], array[q] = (array[q], array[p])
            states.append(qsort_state(array, left, right, x, p, q))
            p += 1
            q -= 1
            if p <= q:
                states.append(qsort_state(array, left, right, x, p, q))
    qsort(array, left, q + 1, states)
    qsort(array, p, right, states)
a = [234, 1, 42, 3, 15, 3, 10, 9, 2]
states = []
qsort(a, 0, len(a), states)
animate_list(states, play=True);
نتيجة
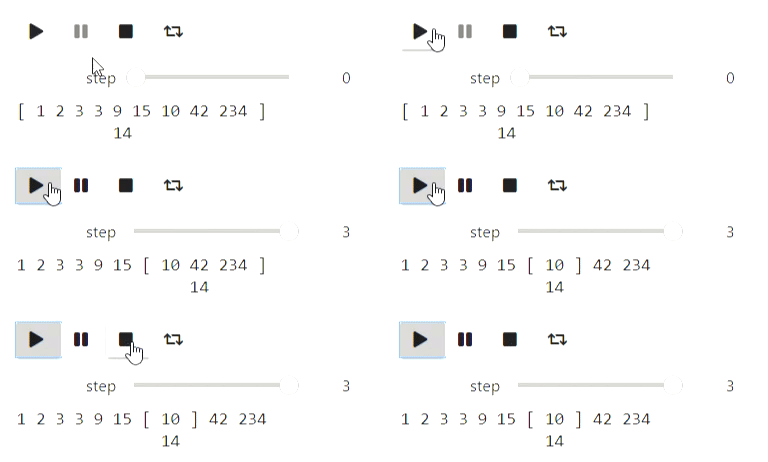
يمكن تصور البحث الثنائي بطريقة مماثلة.
الرمز
def bs_state(array, left, right, x):
    extended_array = list(map(str, array[:left])) + ['['] + list(map(str, array[left: right])) + [']'] + list(map(str, array[right:]))
    mid = (left + right) // 2
    offset_x = sum(list(map(len, extended_array[:mid + 1]))) + mid + 1
    return Code(' '.join(extended_array) + '\n' + ''.join([' ' for i in range(offset_x)]) + str(x))

#       ,
#
states = []
left = 0
right = len(a)
x = 14
while right - left > 1:
    states.append(bs_state(a, left, right, x))
    mid = (left + right) // 2
    if a[mid] <= x:
        left = mid
    else:
        right = mid
states.append(bs_state(a, left, right, x))

animate_list(states, play=True, interval=400);
نتيجة
وإليك مثال للسلاسل النصية: عملية بناء وظيفة البادئة:
الرمز
def prefix_function_state(s, p, k, intermidiate=False):
    third_string = ''.join([s[i] if i < k else ' ' for i in range(len(p))])
    fourth_string = ''.join([s[i] if i >= len(p) - k else ' ' for i in range(len(p))])
    return Code(s + '\n' + ''.join(list(map(str, (p + ['*'] if intermidiate else p )))) \
                  + '\n' + third_string + '\n' + fourth_string)

def prefix_function(s, states):
    p = [0]
    k = 0
    states.append(prefix_function_state(s, p, k))
    for letter in s[1:]:
        states.append(prefix_function_state(s, p, k, True))
        while k > 0 and s[k] != letter:
            k = p[k - 1]
            states.append(prefix_function_state(s, p, k, True))
        if s[k] == letter:
            k += 1
        p.append(k)
        states.append(prefix_function_state(s, p, k))
    return p

states = []
p = prefix_function('ababadababa', states)
animate_list(states, play=True);
نتيجة
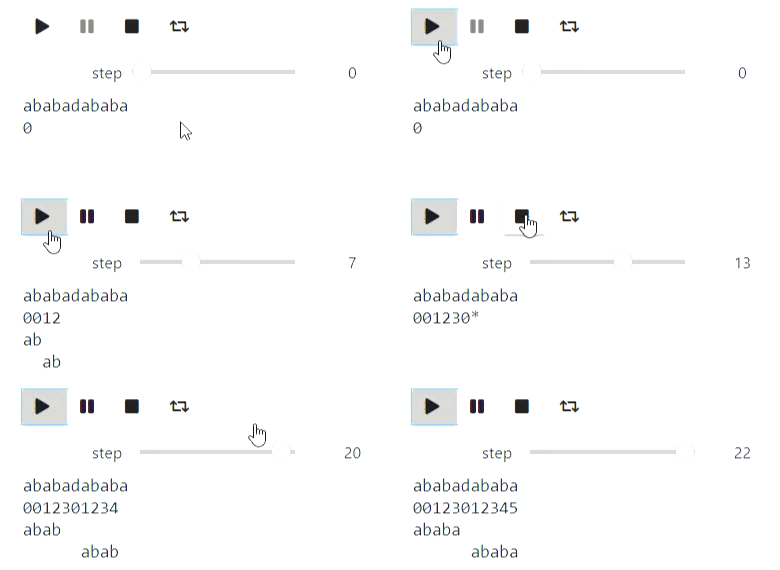
التصور باستخدام Matplotlib
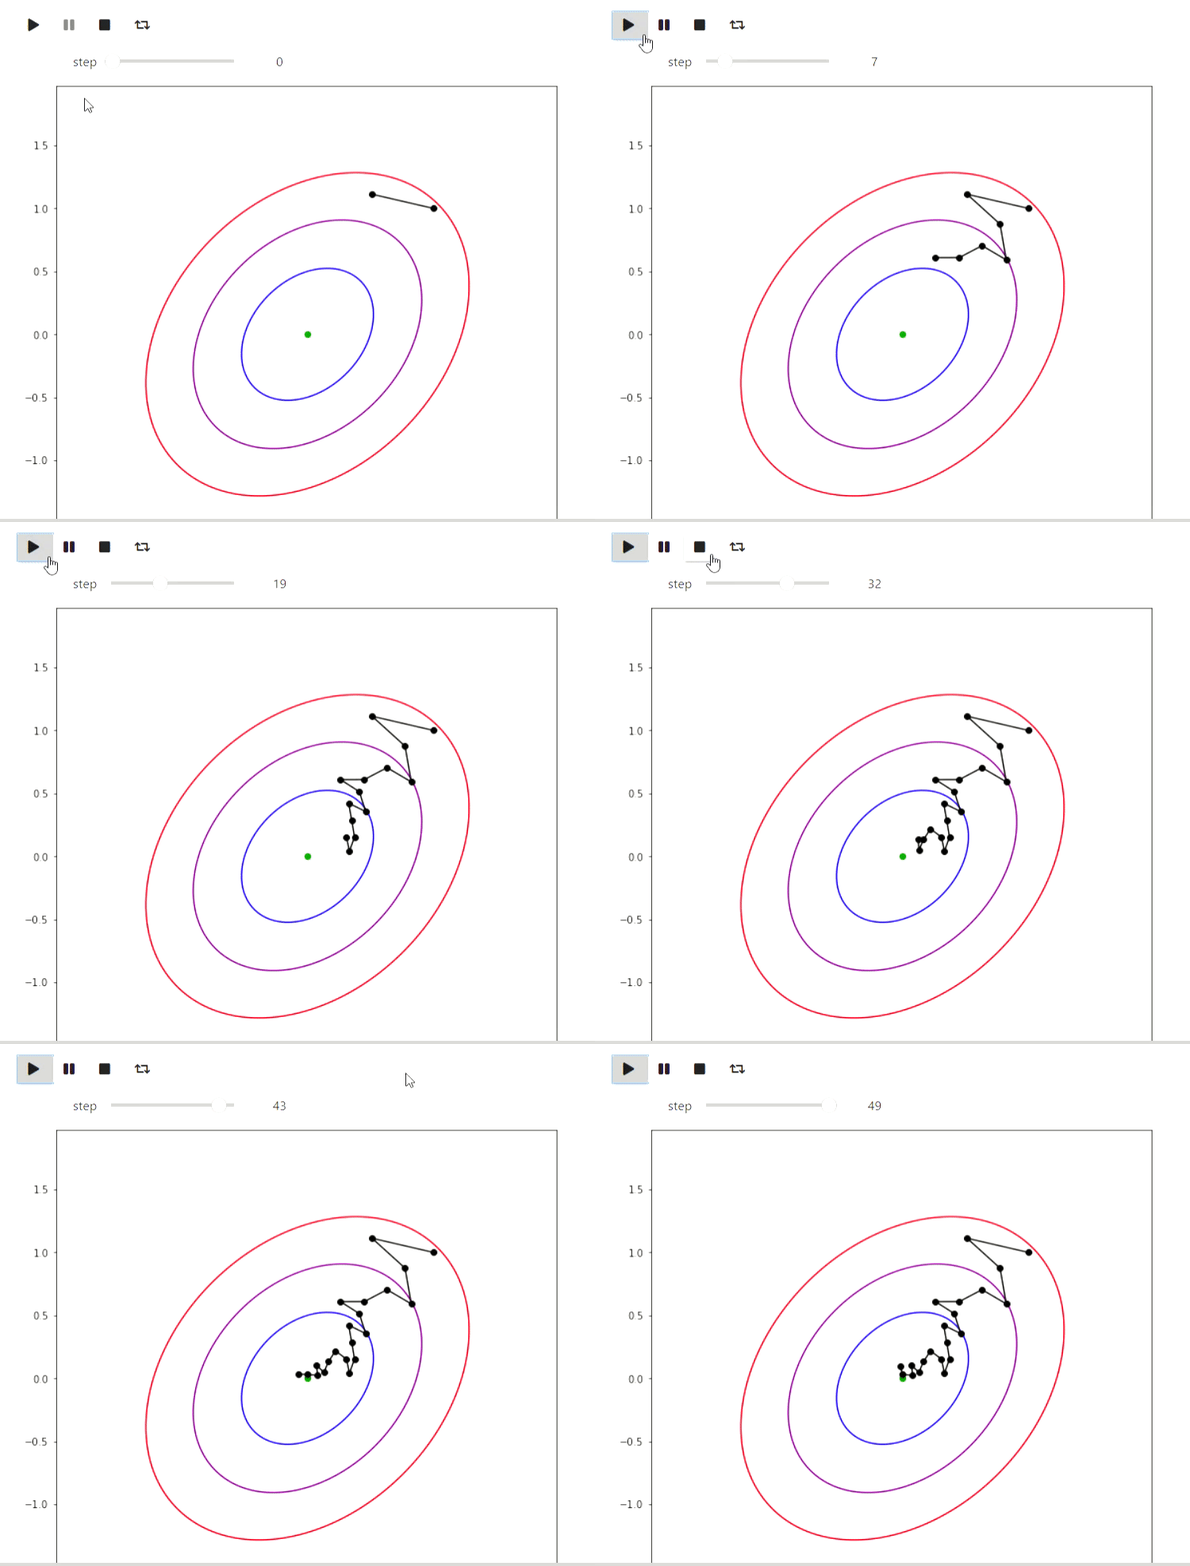
Matplotlib هي مكتبة Python لرسم الرسوم البيانية المختلفة. فيما يلي بعض الأمثلة عن كيفية استخدامه لتصور الخوارزميات. لنبدأ بمثال من الخوارزميات التكرارية للعثور على الحد الأدنى من الوظيفة ، أبسطها هو طريقة البحث المحلي العشوائي ، والتي تُحدث تغييرًا محليًا في التقريب الحالي وتدخل فيه إذا كانت قيمة الدالة عند النقطة الجديدة أفضل:
الرمز
import numpy as np
import matplotlib.pyplot as plt

# ,  ,    (0, 0)
def f(x, y):
    return 1.3 * (x - y) ** 2 + 0.7 * (x + y) ** 2

#
def plot_trajectory(func, traj, limit_point=None):
    fig = plt.figure(figsize=(7, 7))
    ax = fig.add_axes([0, 0, 1, 1])

    if limit_point:
        ax.plot([limit_point[0]], [limit_point[1]], 'o', color='green')
    #Level contours
    delta = 0.025
    x = np.arange(-2, 2, delta)
    y = np.arange(-2, 2, delta)
    X, Y = np.meshgrid(x, y)
    Z = np.zeros_like(X)
    for i in range(X.shape[0]):
        for j in range(X.shape[1]):
            Z[i][j] = func(X[i][j], Y[i][j])
    CS = ax.contour(X, Y, Z, [0.5, 1.5, 3], colors=['blue', 'purple', 'red'])
    ax.plot([u[0] for u in traj], [u[1] for u in traj], color='black')
    ax.plot([u[0] for u in traj], [u[1] for u in traj], 'o', color='black')

    plt.close(fig)
    return fig

x, y = (1.0, 1.0)
num_iters = 50
trajectory = [(x, y)]
plots = []
#
for i in range(num_iters):
    angle = 2 * np.pi * np.random.rand(1)
    dx, dy = (np.cos(angle) / 2 / (i + 1) ** 0.5, np.sin(angle) / 2 / (i + 1) ** 0.5)
    trajectory.append((x + dx, y + dy))
    plots.append(plot_trajectory(f, trajectory, limit_point=(0, 0)))
    if f(x, y) > f(x + dx, y + dy):
        x = x + dx
        y = y + dy
    else:
        trajectory = trajectory[:-1]

animate_list(plots, play=True, interval=300);
نتيجة
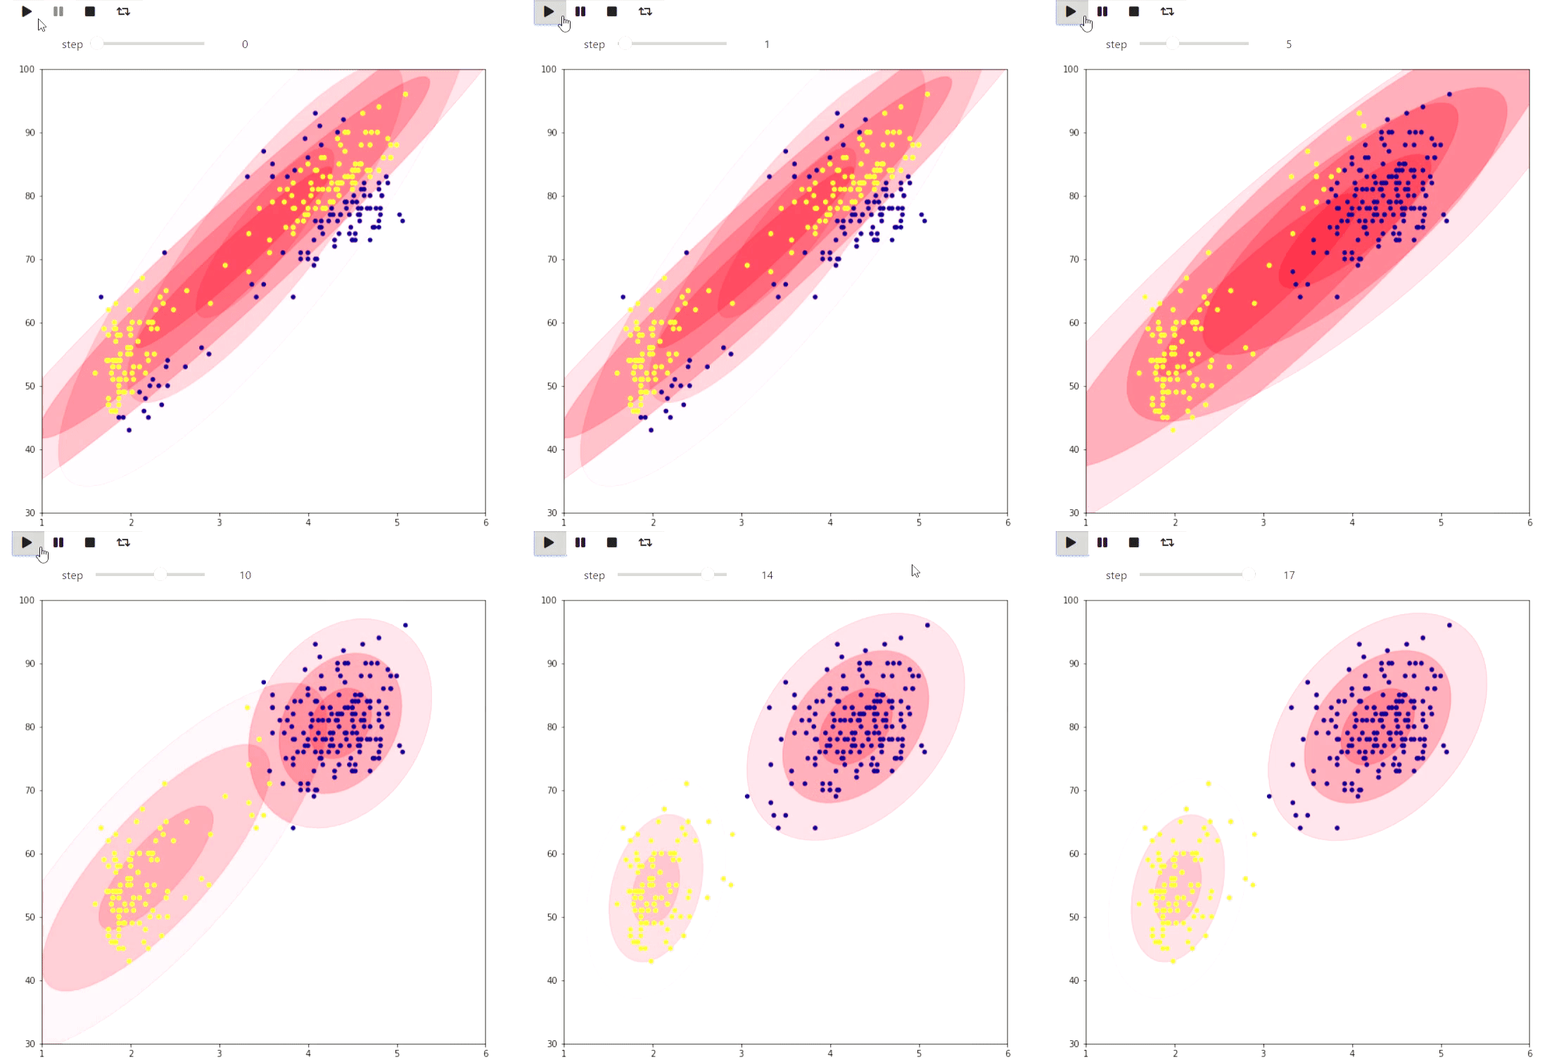
وهنا مثال على خوارزمية EM للبيانات المستمدة من اندلاع نبع ماء حار قديم ، تم تقديم نفس المثال على ويكيبيديا :
الرمز
#
# http://www.stat.cmu.edu/~larry/all-of-statistics/=data/faithful.dat
data = []
with open('data/faithful.csv') as f:
    for line in f:
        _, x, y = line.split(',')
        try:
            data.append((float(x), float(y)))
        except ValueError:
            pass

colors = ['red', 'blue', 'yellow', 'green']

#    https://jakevdp.github.io/PythonDataScienceHandbook/05.12-gaussian-mixtures.html
from matplotlib.patches import Ellipse

def draw_ellipse(position, covariance, ax=None, **kwargs):
    """Draw an ellipse with a given position and covariance"""
    ax = ax or plt.gca()

    # Convert covariance to principal axes
    if covariance.shape == (2, 2):
        U, s, Vt = np.linalg.svd(covariance)
        angle = np.degrees(np.arctan2(U[1, 0], U[0, 0]))
        width, height = 2 * np.sqrt(s)
    else:
        angle = 0
        width, height = 2 * np.sqrt(covariance)

    # Draw the Ellipse
    for nsig in range(1, 4):
        ax.add_patch(Ellipse(position, nsig * width, nsig * height,
                             angle, color='red', **kwargs))

def plot_gmm(gmm, X, label=True, ax=None):
    ax = ax or plt.gca()
    if label:
        labels = gmm.predict(X)
        ax.scatter(X[:, 0], X[:, 1], c=labels, s=20, cmap='plasma', zorder=2)
    else:
        ax.scatter(X[:, 0], X[:, 1], s=20, zorder=2)

    w_factor = 0.2 / gmm.weights_.max()
    for pos, covar, w in zip(gmm.means_, gmm.covariances_, gmm.weights_):
        draw_ellipse(pos, covar, alpha=w * w_factor)

def step_figure(gmm, X, label=True):
    fig = plt.figure(figsize=(7, 7))
    ax = fig.add_axes([0, 0, 1, 1])
    ax.set_ylim(30, 100)
    ax.set_xlim(1, 6)
    plot_gmm(gmm, X, label=True, ax=ax)
    plt.close(fig)
    return fig

from sklearn.mixture import GaussianMixture

x = np.array(data)
# max_iters=1  warm_start=True  gmm.fit
#
gmm = GaussianMixture(2, warm_start=True, init_params='random', max_iter=1)
# GMM    ,
import warnings
warnings.simplefilter('ignore')
#
gmm.fit(x[:10,:])
steps = [step_figure(gmm, x)]
for i in range(17):
    gmm.fit(x)
    steps.append(step_figure(gmm, x))

animate_list(steps, play=True, interval=400);
نتيجة
المثال التالي هو أكثر من لعبة ، ولكنه يوضح أيضًا ما يمكن فعله في matplotlib: تصور تبليط شكل متقلب على مستوى مع أقصى عدد من قطع الدومينو من خلال إيجاد أقصى تطابق:
الرمز
#   matplotlib   ,
from animation_utils.matplotlib import draw_filling

def check_valid(i, j, n, m, tiling):
    return 0 <= i and i < n and 0 <= j and j < m and tiling[i][j] != '#'

def find_augmenting_path(x, y, n, m, visited, matched, tiling):
    if not check_valid(x, y, n, m, tiling):
        return False
    if (x, y) in visited:
        return False
    visited.add((x, y))

    for dx, dy in [(-1, 0), (1, 0), (0, -1), (0, 1)]:
        if not check_valid(x + dx, y + dy, n, m, tiling):
            continue
        if (x + dx, y + dy) not in matched or find_augmenting_path(*matched[(x + dx , y + dy)], n, m, visited, matched, tiling):
            matched[(x + dx, y + dy)] = (x, y)
            return True
    return False

def convert_match(matched, tiling, n, m):
    result = [[-1 if tiling[i][j] == '#' else -2 for j in range(m)] for i in range(n)]
    num = 0
    for x, y in matched:
        _x, _y = matched[(x, y)]
        result[x][y] = num
        result[_x][_y] = num
        num += 1
    return result

def match_with_flow(tiling):
    result_slices = []
    n = len(tiling)
    m = len(tiling[0])

    matched = dict()
    #
    rows = list(range(n))
    columns = list(range(m))
    random.shuffle(rows)
    random.shuffle(columns)
    result_slices.append(convert_match(matched, tiling, n, m))

    for i in rows:
        for j in columns:
            if (i + j) % 2 == 1:
                continue
            visited = set()
            if find_augmenting_path(i, j, n, m, visited, matched, tiling):
                result_slices.append(convert_match(matched, tiling, n, m))

    return result_slices

tiling_custom=[
    '...####',
    '....###',
    '......#',
    '#.#....',
    '#......',
    '##.....',
    '###...#',
]
sequencial_match = match_with_flow(tiling_custom)
animate_list(list(map(draw_filling, sequencial_match)), play=True);
نتيجة
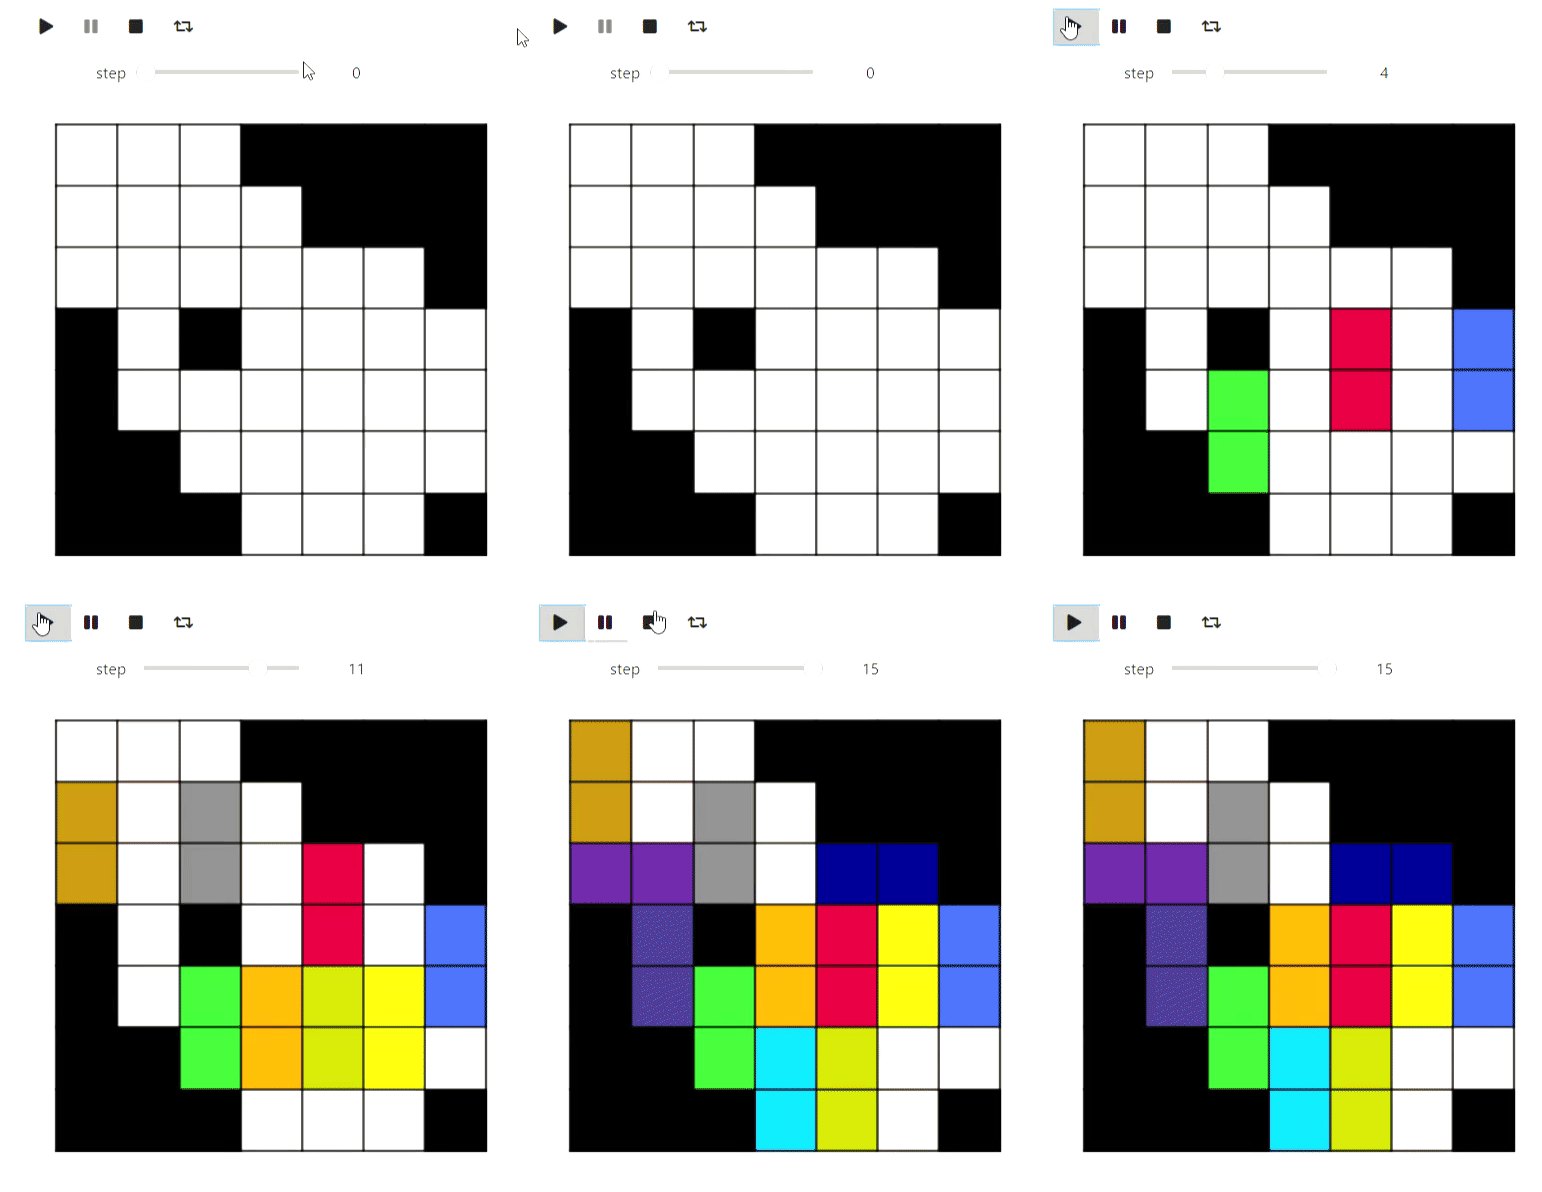
حسنًا ، على طول الطريق ، عرض توضيحي لخوارزمية تلوين رسم بياني مستوٍ بخمسة ألوان ، بحيث يبدو القسم بصريًا أفضل:
الرمز
def color_5(filling):
    result = [[i for i in row] for row in filling]
    #
    domino_tiles = [[] for i in range(max(map(max, filling)) + 1)]
    domino_neighbours = [set() for i in range(max(map(max, filling)) + 1)]
    degree = [0 for i in range(max(map(max, filling)) + 1)]

    n = len(filling)
    m = len(filling[0])

    for i, row in enumerate(filling):
        for j, num in enumerate(row):
            if num >= 0:
                domino_tiles[num].append((i, j))

    for i, tiles in enumerate(domino_tiles):
        for x, y in tiles:
            for dx, dy in [(-1, 0), (1, 0), (0, -1), (0, 1), (-1, -1), (-1, 1), (1, -1), (1, 1)]:
                a, b = x + dx, y + dy
                if 0 <= a and a < n and 0 <= b and b < m and filling[a][b] >= 0 and filling[a][b] != i \
                        and filling[a][b] not in domino_neighbours[i]:
                    domino_neighbours[i].add(filling[a][b])
                    degree[i] += 1

    #       ,      5
    # .     ,   ,
    #           ,
    active_degrees = [set() for i in range(max(degree) + 1)]
    for i, deg in enumerate(degree):
        active_degrees[deg].add(i)

    reversed_order = []

    for step in range(len(domino_tiles)):
        min_degree = min([i for i, dominoes in enumerate(active_degrees) if len(dominoes) > 0])
        domino = active_degrees[min_degree].pop()

        reversed_order.append(domino)
        for other in domino_neighbours[domino]:
            if other in active_degrees[degree[other]]:
                active_degrees[degree[other]].remove(other)
                degree[other] -= 1
                active_degrees[degree[other]].add(other)

    #             ,
    #     5 ,      ,
    #    .
    colors = [-1 for domino in domino_tiles]
    slices = [draw_filling(result)]
    for domino in reversed(reversed_order):
        used_colors = [colors[other] for other in domino_neighbours[domino] if colors[other] != -1]

        domino_color = len(used_colors)
        for i, color in enumerate(sorted(set(used_colors))):
            if i != color:
                domino_color = i
                break

        if domino_color < 5:
            colors[domino] = domino_color
            for x, y in domino_tiles[domino]:
                result[x][y] = domino_color

            slices.append(draw_filling(result))
            continue

        #      ,
        c = 0
        other = [other for other in domino_neighbours[domino] if colors[other] == c]
        visited = set([other])
        q = Queue()
        q.put(other)
        domino_was_reached = False
        while not q.empty():
            cur = q.get()
            for other in domino_neighbours[cur]:
                if other == domino:
                    domino_was_reached = True
                    break
                if color[other] == c or color[other] == c + 1 and other not in visited:
                    visited.add(other)
                    q.put(other)

        if not domino_was_reached:
            for other in visited:
                color[other] = color[other] ^ 1
                for x, y in domino_tiles[other]:
                    result[x][y] = color[other]
            color[domino] = c
            for x, y in domino_tiles[domino]:
                result[x][y] = c

            slices.append(draw_filling(result))
            continue

        #     2  3.
        c = 2
        other = [other for other in domino_neighbours[domino] if colors[other] == c]
        visited = set([other])
        q = Queue()
        q.put(other)
        domino_was_reached = False
        while not q.empty():
            cur = q.get()
            for other in domino_neighbours[cur]:
                if other == domino:
                    domino_was_reached = True
                    break
                if color[other] == c or color[other] == c + 1 and other not in visited:
                    visited.add(other)
                    q.put(other)
        for other in visited:
            color[other] = color[other] ^ 1
            for x, y in domino_tiles[other]:
                result[x][y] = color[other]
        color[domino] = c
        for x, y in domino_tiles[domino]:
            result[x][y] = c
        slices.append(draw_filling(result))

    return result, slices

filling_colored, slices =color_5(sequencial_match[-1])
animate_list(slices, play=True);
نتيجة
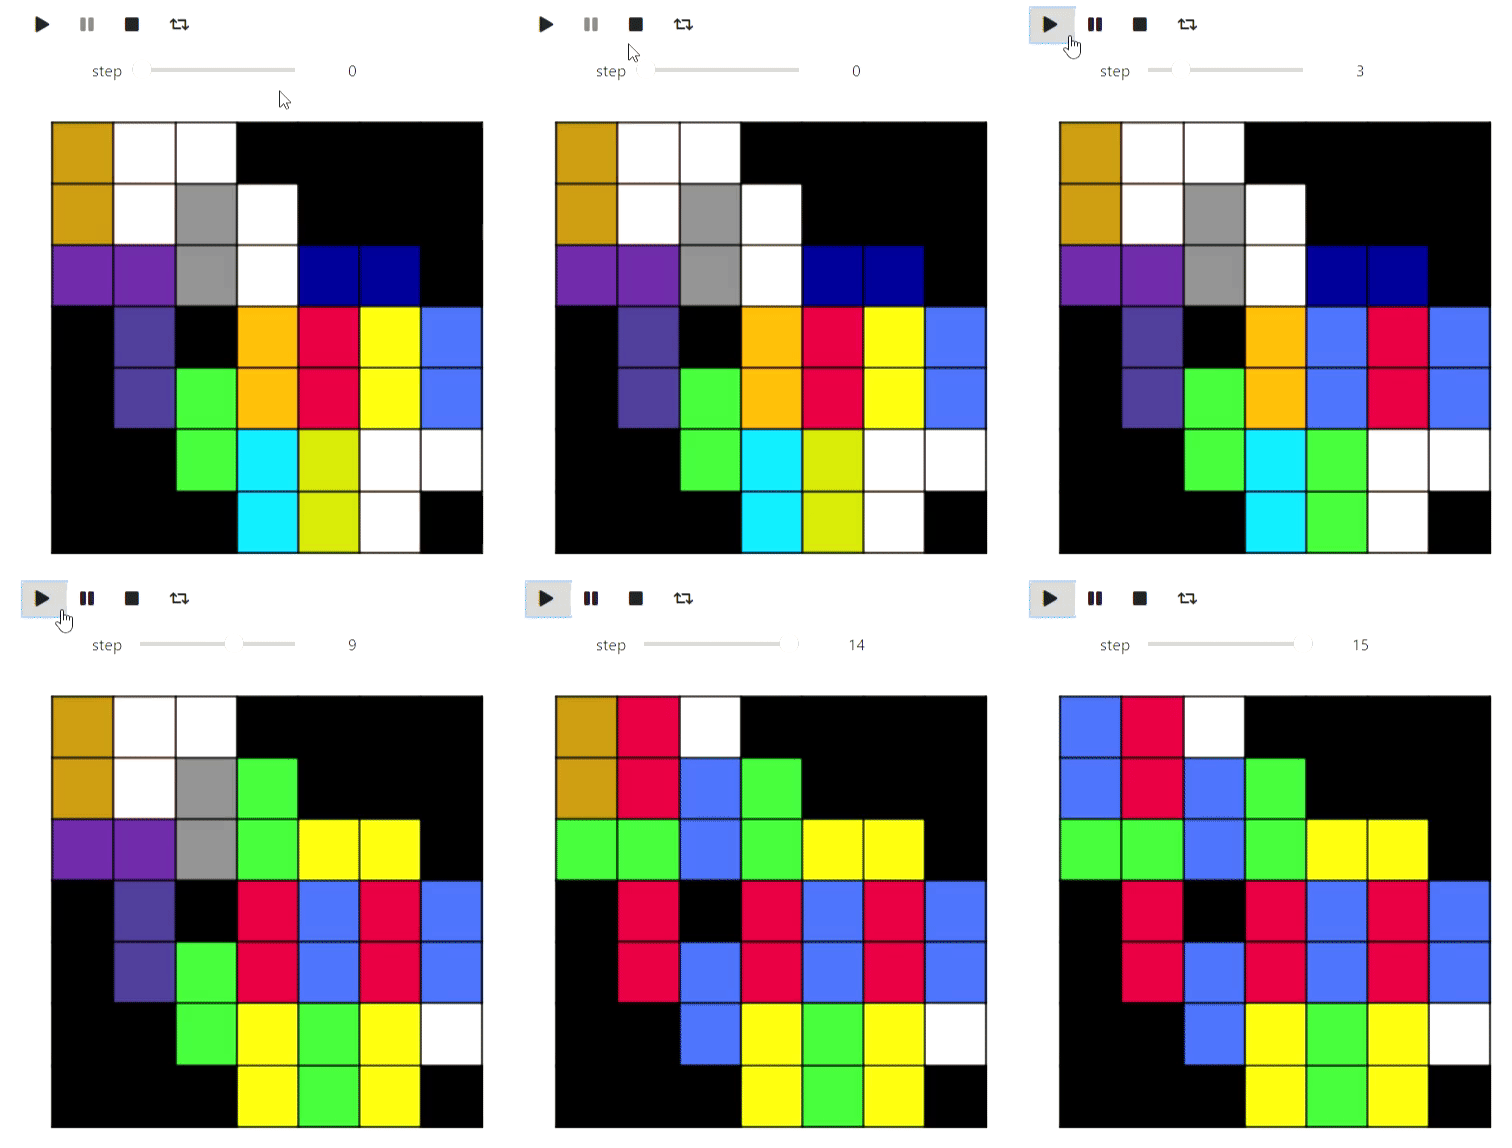
المثال الأخير مع matplotlib من الهندسة الحسابية هو خوارزمية Graham-Andrew لتخطيط هيكل محدب على متن طائرة:
الرمز
def convex_hull_state(points, lower_path, upper_path):
    fig = plt.figure(figsize=(6, 6))
    ax = fig.add_axes([0, 0, 1, 1])

    ax.get_xaxis().set_visible(False)
    ax.get_yaxis().set_visible(False)

    for name, spine in ax.spines.items():
        spine.set_visible(False)
        spine.set_visible(False)

    ax.scatter([x for x, y in points], [y for x, y in points])
    ax.plot([x for x, _ in lower_path], [y for _, y in lower_path], color='red')
    ax.plot([x for x, _ in upper_path], [y for _, y in upper_path], color='blue')

    plt.close(fig)
    return fig

def vector_prod(point_a, point_b):
    return point_a[0] *  point_b[1] - point_a[1] * point_b[0]

def convex_hull(poitns):
    sorted_points = sorted(points, key=lambda x: x[1])
    sorted_points = sorted(sorted_points, key=lambda x: x[0])
    states = []

    upper_path = [sorted_points[0]]
    lower_path = [sorted_points[0]]
    states.append(convex_hull_state(points, lower_path, upper_path))

    for point in sorted_points[1:]:
        while len(upper_path) > 1 and vector_prod(point - upper_path[-1], upper_path[-1] - upper_path[-2]) > 0:
            upper_path = upper_path[:-1]
            upper_path.append(point)
            states.append(convex_hull_state(poitns, lower_path, upper_path))
            upper_path = upper_path[:-1]
        upper_path.append(point)
        states.append(convex_hull_state(points, lower_path, upper_path))

    for point in sorted_points[1:]:
        while len(lower_path) > 1 and vector_prod(point - lower_path[-1], lower_path[-1] - lower_path[-2]) < 0:
            lower_path = lower_path[:-1]
            lower_path.append(point)
            states.append(convex_hull_state(poitns, lower_path, upper_path))
            lower_path = lower_path[:-1]
        lower_path.append(point)
        states.append(convex_hull_state(poitns, lower_path, upper_path))

    return states

points = [np.random.rand(2) for i in range(20)]
states = convex_hull(points)
animate_list(states, play=True, interval=300);
نتيجة
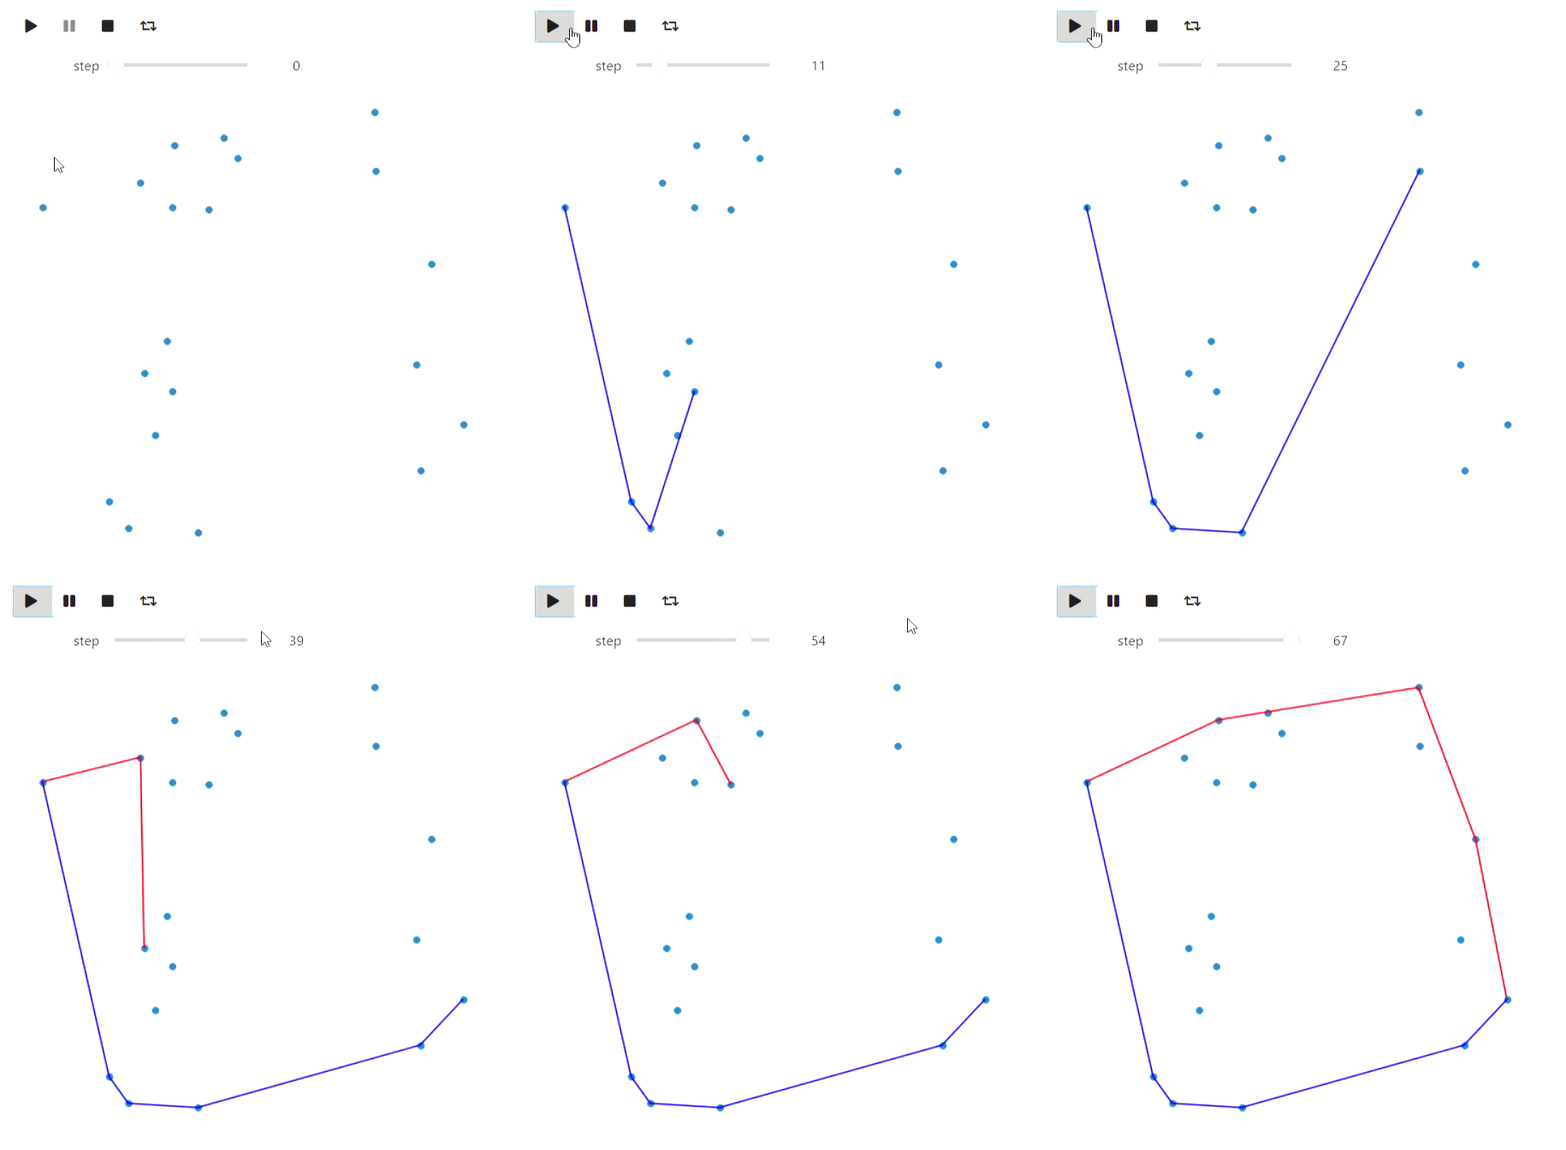
آخر شيء أود ملاحظته في سياق matplotlib هو طريقة بديلة لإنشاء رسوم متحركة من خلال matplotlib.animation.FuncAnimation. هذه الطريقة لها مزاياها: يمكن تحويلها إلى html باستخدام IPython.display.HTML ، ستكون النتيجة أكثر موثوقية من تلك الموجودة على الأدوات (يتم إبطاء عناصر واجهة المستخدم الخاصة بي بشكل دوري) ، ولن تتطلب نواة عمل Jupyter ، ولكن في هذه الحالة تكون الرسوم المتحركة عادية الفيديو وعناصر التحكم مقصورة على المشغل.
جراففيز
يمكن استخدام Graphviz لرسم الرسوم البيانية. يرجى ملاحظة أنه من أجل إعادة إنتاج أمثلة باستخدامه ، ستحتاج إلى تثبيت Graphviz ليس فقط في Python ، ولكن أيضًا على النظام . لنبدأ باجتياز العمق أولاً:
الرمز
#
from graph_utils.graph import Graph, Arc, Node

def enter_node(node):
    node.SetColor('blue')

def enter_arc(node, arc):
    node.SetColor('green')
    arc.attributes['style'] = 'dashed'
    arc.attributes['color'] = 'green'

def return_from_arc(node, arc):
    arc.attributes['style'] = 'solid'
    arc.attributes['color'] = 'red'
    node.SetColor('blue')

def ignore_arc(arc):
    arc.attributes['color'] = 'blue'

def leave_node(node):
    node.SetColor('red')

def dfs(graph, node_id, visited, outlist, path):
    visited.add(node_id)
    path.append(node_id)
    enter_node(graph.nodes[node_id])
    outlist.append(graph.Visualize())
    for arc in graph.nodes[node_id].arcs:
        if arc.end not in visited:
            enter_arc(graph.nodes[node_id], arc)
            dfs(graph, arc.end, visited, outlist, path)
            return_from_arc(graph.nodes[node_id], arc)
            path.append(node_id)
        else:
            ignore_arc(arc)
        outlist.append(graph.Visualize())
    leave_node(graph.nodes[node_id])

arcs = [
    Arc(1, 3, 3),
    Arc(1, 4, 7),
    Arc(4, 3, 2),
    Arc(4, 5, 3),
    Arc(1, 5, 2),
    Arc(6, 4, 2),
    Arc(5, 6, 2),
    Arc(6, 7, 1),
    Arc(7, 2, 7),
    Arc(4, 2, 2),
    Arc(3, 2, 5)
]

#     ,      `dot`,
#      graphviz
# https://graphviz.org/download/
graph = Graph(arcs)
visited = set()
dfs_outlist = []
path = []
dfs_outlist.append(graph.Visualize())
dfs(graph, 1, visited, dfs_outlist, path)
dfs_outlist.append(graph.Visualize())
animate_list(dfs_outlist, play=True, interval=400);
نتيجة
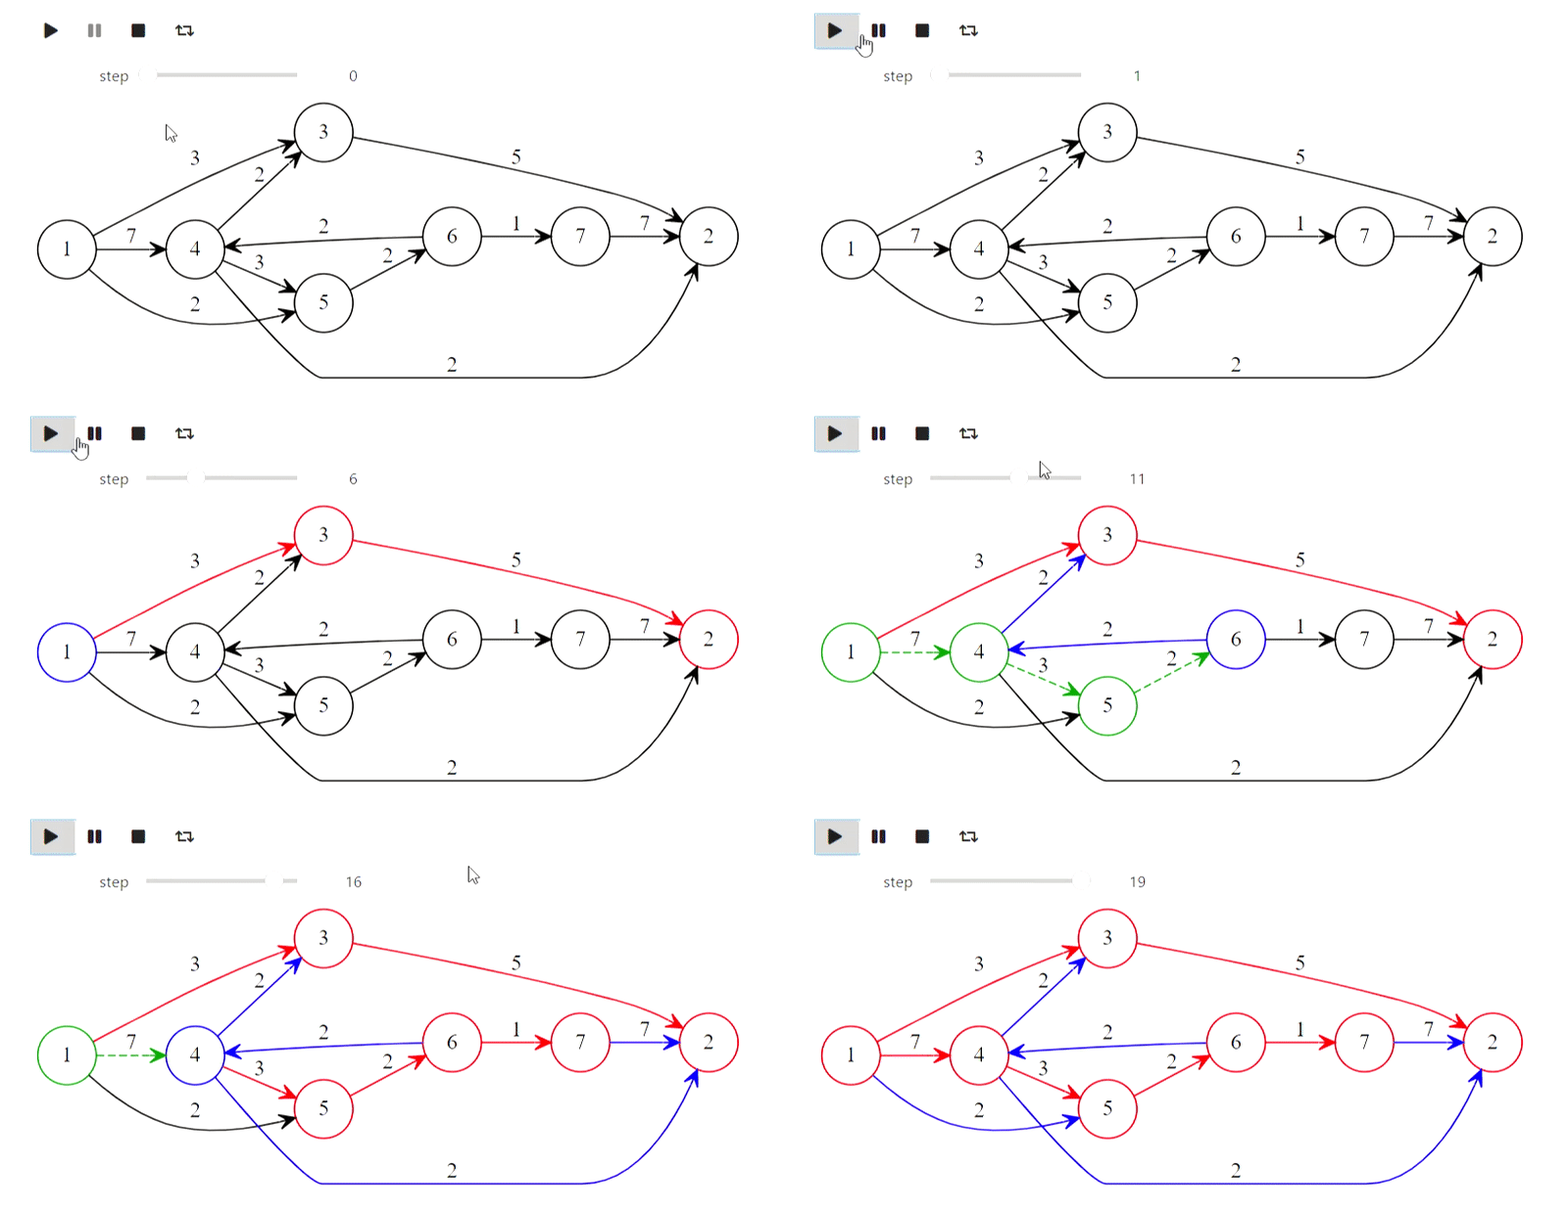
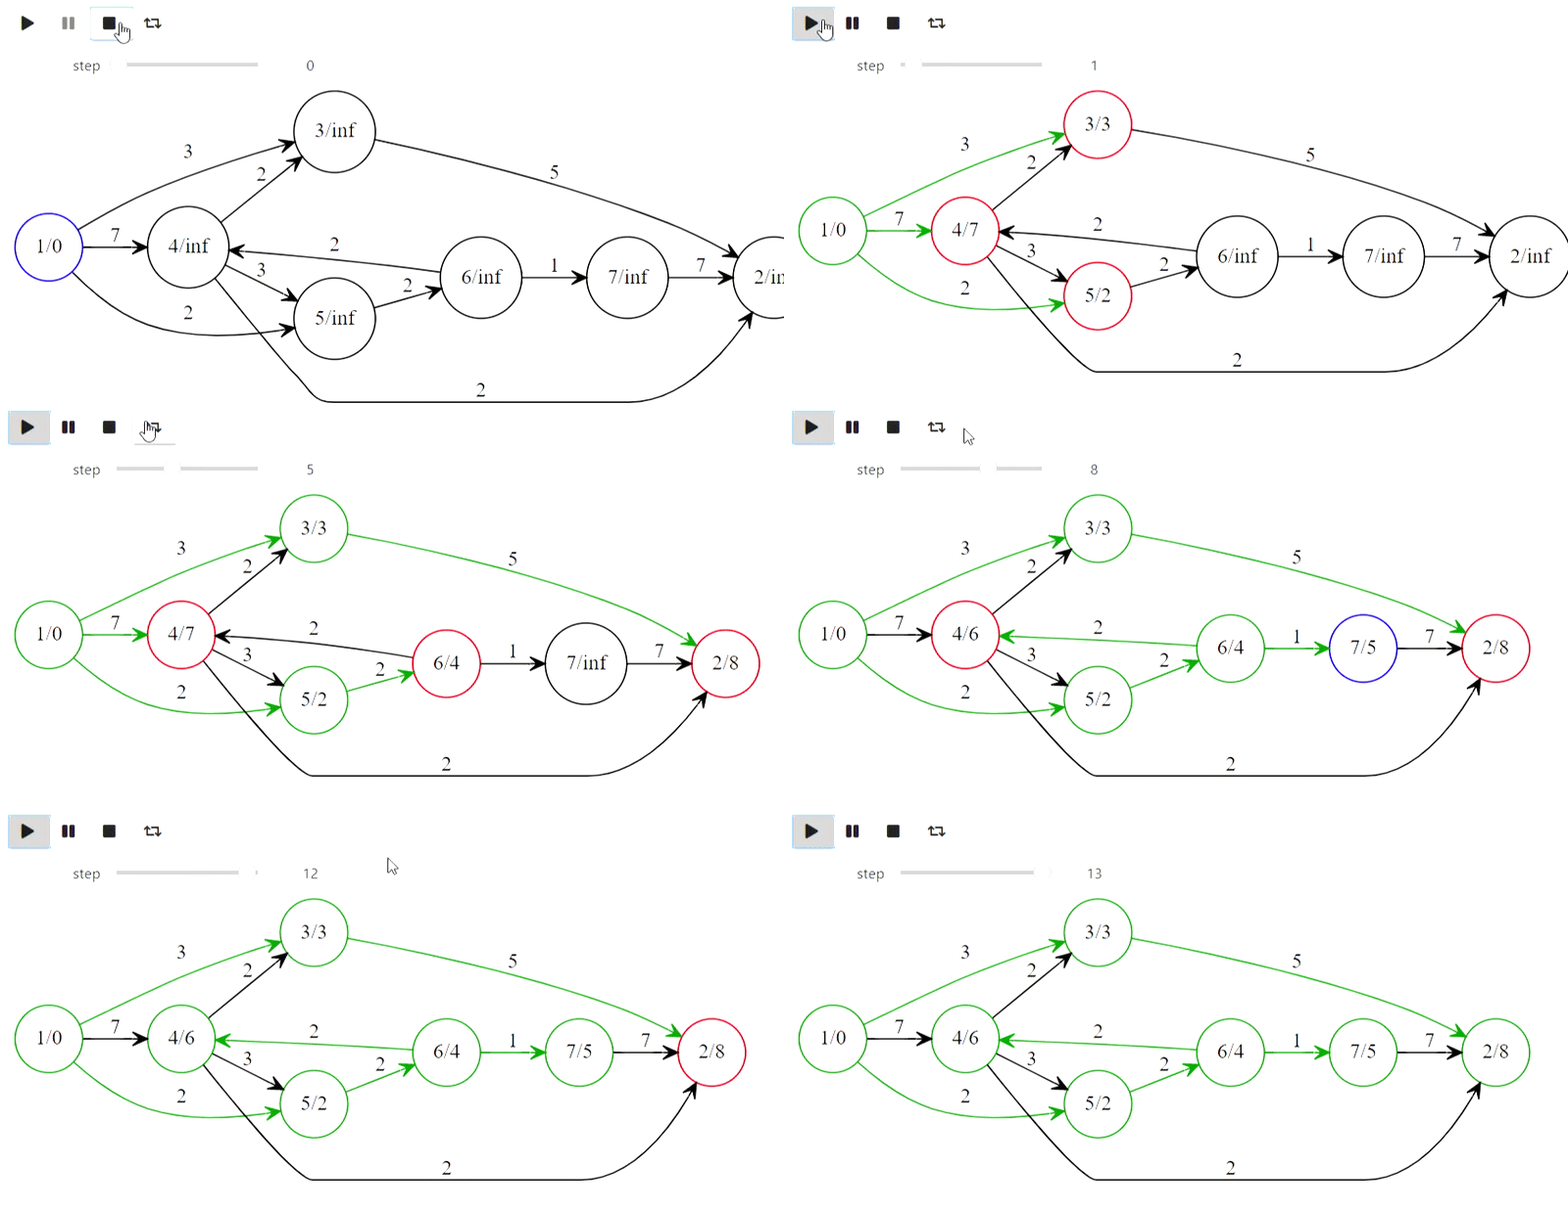
حسنًا ، ها هي خوارزمية Dijkstra من العنوان
الرمز
def mark_labelled(node):
    node.SetColor('red')

def mark_scanned(node):
    node.SetColor('green')

def process_node(node):
    node.SetColor('blue')

def set_previous(arc):
    arc.SetColor('green')

def unset_previous(arc):
    arc.SetColor('black')

def scan_arc(graph, arc, l, p, mark):
    if l[arc.end] > l[arc.beginning] + arc.weight:
        l[arc.end] = l[arc.beginning] + arc.weight
        if p[arc.end] is not None:
            unset_previous(p[arc.end])
        #  arc,   arc.beginning,
        p[arc.end] = arc
        set_previous(p[arc.end])
        mark[arc.end] = True
        mark_labelled(graph.nodes[arc.end])

def scan_node(graph, node_id, l, p, mark):
    for arc in graph.nodes[node_id].arcs:
        scan_arc(graph, arc, l, p, mark)
    mark[node_id] = False
    mark_scanned(graph.nodes[node_id])


#      ,
#  ,
# http://forskning.diku.dk/PATH05/GoldbergSlides.pdf
def base_scanning_method(graph, s, choice_function):
    l    = {key: float('Inf') for key in graph.nodes.keys()}
    p    = {key: None for key in graph.nodes.keys()}
    mark = {key: False for key in graph.nodes.keys()}

    l[s] = 0
    mark[s] = True
    mark_labelled(graph.nodes[s])

    out_lst = []

    while True:
        node_id = choice_function(l, mark)
        if node_id is None:
            break
        process_node(graph.nodes[node_id])
        out_lst.append(graph.Visualize(l))
        scan_node(graph, node_id, l, p, mark)
        out_lst.append(graph.Visualize(l))
    return l, p, out_lst

#
def least_distance_choice(l, mark):
    labelled = [node_id for node_id, value in mark.items() if value == True]
    if len(labelled) == 0:
        return None
    return min(labelled, key=lambda x: l[x])

graph = Graph(arcs)
l, p, bfs_shortest_path_lst = \
    base_scanning_method(graph, 1, least_distance_choice)
animate_list(bfs_shortest_path_lst, play=True, interval=400);
نتيجة
وهذه هي الطريقة التي يتم بها إنشاء شجرة البادئة لكلمات "أم" و "أم" و "قرد" و "صابون" و "حليب":
الرمز
class TrieNode:
    def __init__(self, parent, word=None):
        #     ,
        #
        self.parent = parent
        #  ,
        self.word = word
        self.children = {}
        self.suff_link = None

def init_trie():
    trie = [TrieNode(-1)]
    return trie

def to_graph(trie):
    arcs = []
    for i, node in enumerate(trie):
        for c, nextstate in node.children.items():
            arcs.append(Arc(i, nextstate, c))
        if node.suff_link is not None and node.suff_link != 0:
            arcs.append(Arc(i,
                            node.suff_link,
                            attributes={"constraint" : "False", "style" : "dashed"}))

    return Graph(arcs)

def add_word(trie, word, steps):
    _num = 0
    for ch in word:
        if not ch in trie[_num].children:
            _n = len(trie)
            trie[_num].children[ch] = _n
            trie.append(TrieNode((_num, ch)))
        _num = trie[_num].children[ch]
        graph = to_graph(trie)
        graph.nodes[_num].SetColor('red')
        steps.append(graph.Visualize())
    trie[_num].word = word

def make_trie(words):
    steps = []
    trie = init_trie()
    steps.append(to_graph(trie).Visualize())
    for word in words:
        add_word(trie, word, steps)
        steps.append(to_graph(trie).Visualize())
    return trie, steps

words = [
    '',
    '',
    '',
    '',
    ''
]
trie, steps = make_trie(words)
animate_list(steps, play=True, interval=500);
نتيجة
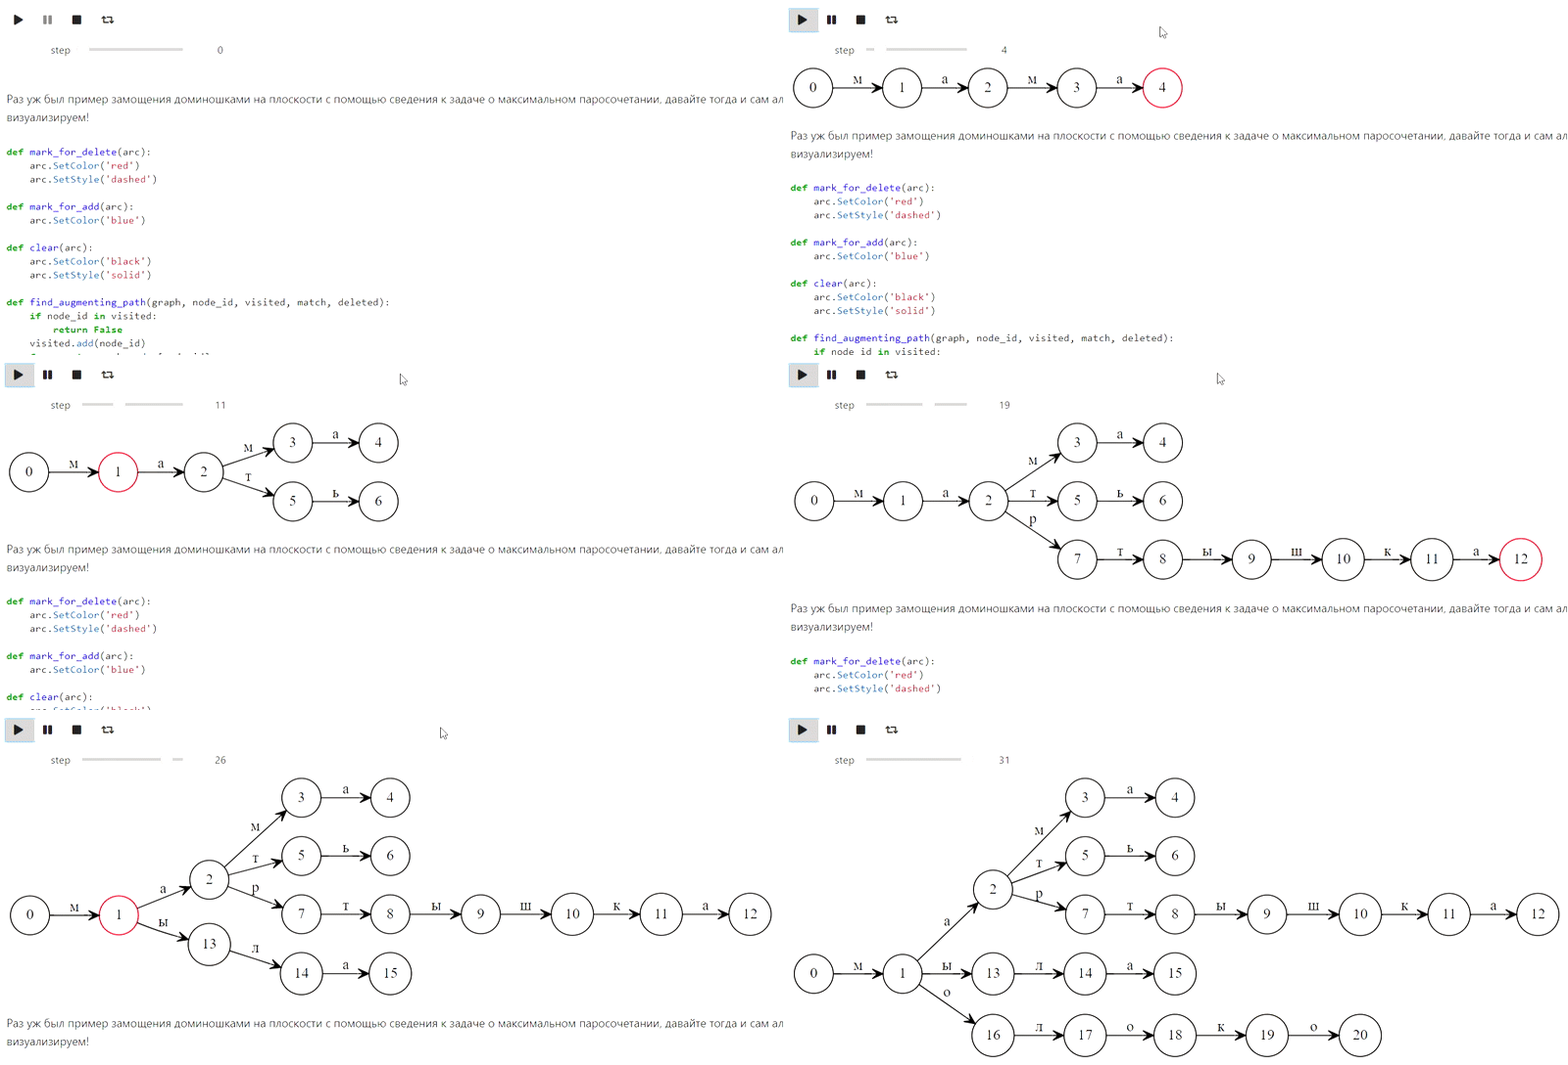
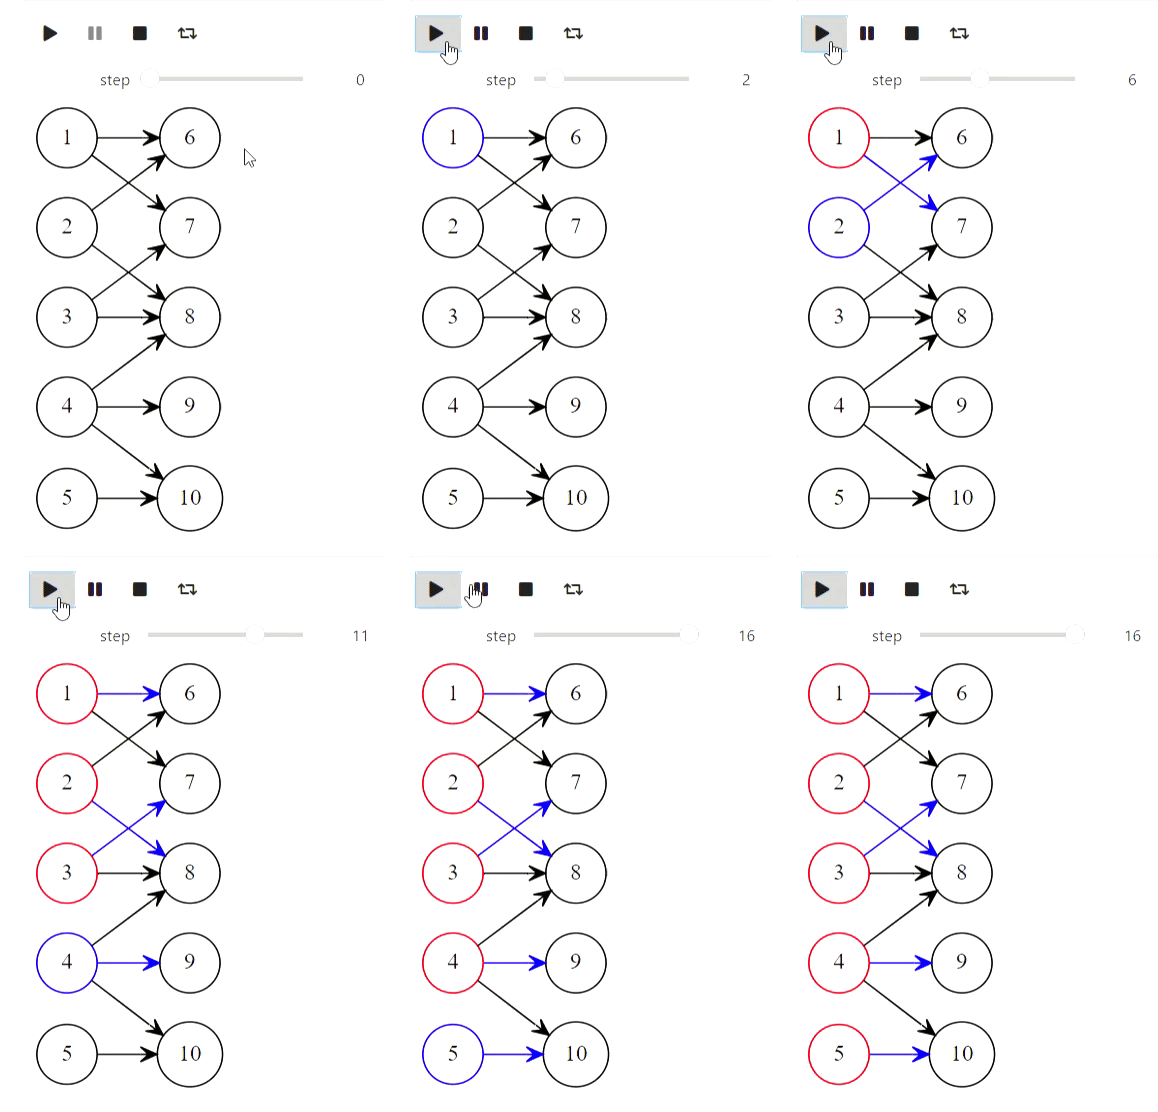
وأخيرًا ، خوارزمية Kuhn لإيجاد أقصى تطابق:
الرمز
def mark_for_delete(arc):
    arc.SetColor('red')
    arc.SetStyle('dashed')

def mark_for_add(arc):
    arc.SetColor('blue')

def clear(arc):
    arc.SetColor('black')
    arc.SetStyle('solid')

def find_augmenting_path(graph, node_id, visited, match, deleted):
    if node_id in visited:
        return False
    visited.add(node_id)
    for arc in graph.nodes[node_id].arcs:
        if arc.end not in match or find_augmenting_path(graph, match[arc.end].beginning, visited, match, deleted):
            if arc.end in match:
                mark_for_delete(match[arc.end])
                deleted.append(match[arc.end])
            match[arc.end] = arc
            mark_for_add(arc)
            return True
    return False

def kuhns_matching(graph, first_part):
    states = [graph.Visualize()]
    match = dict()
    for node_id in first_part:
        node = graph.nodes[node_id]
        node.SetColor('Blue')
        states.append(graph.Visualize())
        deleted = []
        if find_augmenting_path(graph, node_id, set(), match, deleted):
            states.append(graph.Visualize())
            for arc in deleted:
                clear(arc)
            states.append(graph.Visualize())
        node.SetColor('red')
    states.append(graph.Visualize())
    return states

arcs = [
    Arc(1, 6),
    Arc(1, 7),
    Arc(2, 6),
    Arc(3, 7),
    Arc(3, 8),
    Arc(4, 8),
    Arc(4, 9),
    Arc(4, 10),
    Arc(5, 10),
    Arc(2, 8)
]
first_part = [1, 2, 3, 4, 5]
graph = Graph(arcs)
states = kuhns_matching(graph, first_part)

animate_list(states, play=True, interval=400);
نتيجة
الخوارزميات مع المصفوفات
لكن هذا الجزء يشير إلى المحاولة الفاشلة. يمكن لـ IPython.display تحليل مادة اللاتكس ، لكن عندما حاولت استخدامه ، هذا ما حصلت عليه (كان يجب أن يكون هناك طريقة غاوسية):
الرمز
from animation_utils.latex import Matrix
from IPython.display import Math

n = 5
A = np.random.rand(n, n)
L = np.identity(n)
U = np.array(A)
steps = []
steps.append(Math(str(Matrix(L)) + str(Matrix(U))))
for k in range(n):
    x = U[k,k]
    for i in range(k+1, n):
        L[i,k] = U[i,k] / x
        U[i,k:] -= L[i,k] * U[k,k:]
    steps.append(Math(str(Matrix(L)) + str(Matrix(U))))

animate_list(steps, play=True, interval=500);
نتيجة
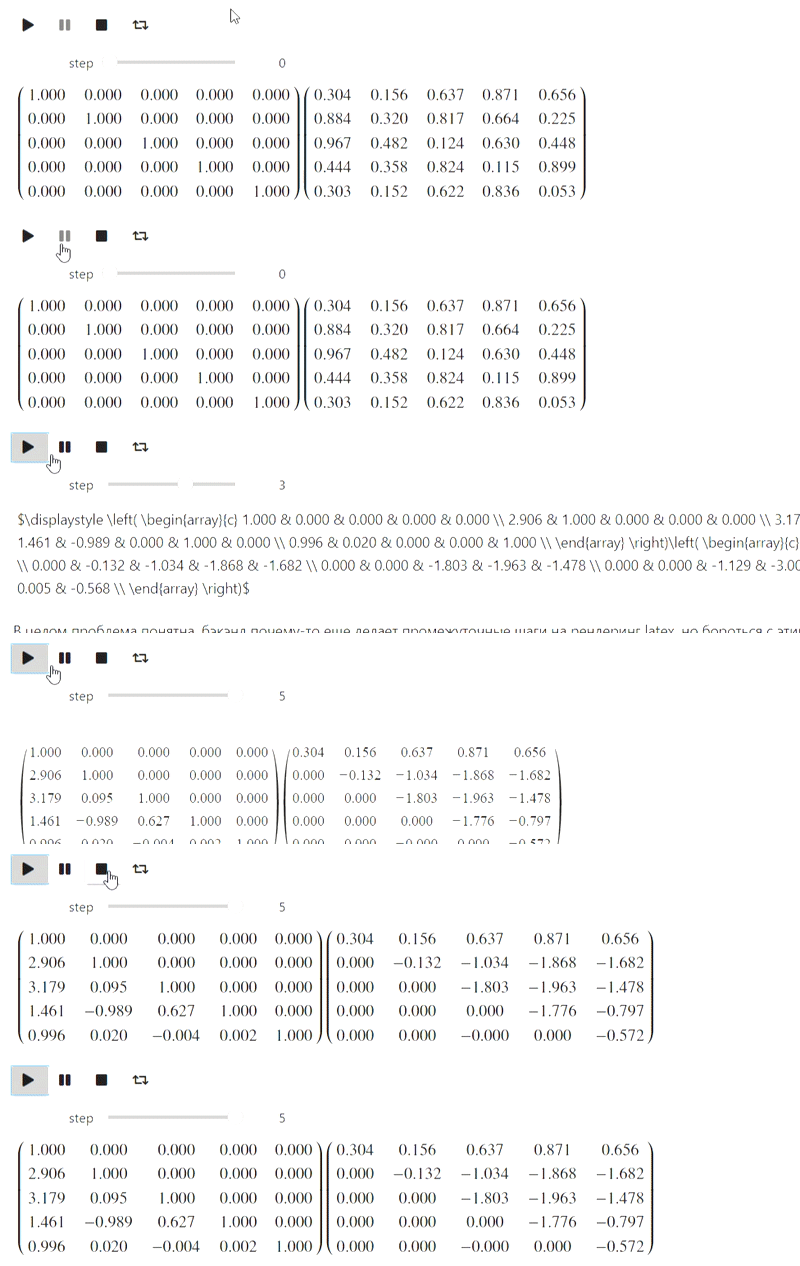
حتى الآن لا أعرف ماذا أفعل بهذا ، لكن ربما سيدفع الناس المطلعون.